
Investors often become dazzled by long periods of robust returns only to be blinded by sudden downturns.
While some investors have decades to ride out volatility and heavy capital losses, retirees are not among them. They need to pay greater attention to these risks while still attempting to maximise returns.
They face a number of options–and they all have a cost. There’s “no free lunch” when it comes to investing.
However, measuring the true performance of strategies which place a greater emphasis on risk management is still sorely lacking and often misleading.
The shortcoming of popular benchmarks
Typical benchmarks don’t incorporate the risks faced by retirees (or investors with relatively short-term time horizons).
For example, most share investors rank their short-term returns against major indices such as the S&P/ASX 200 or the S&P 500. Their longer term expectations are also typically based on annualised returns which smooth out the impact of volatility and protracted downturns.
This is a deadly approach for retirees.
For example, the average total annualised standard deviation of the S&P/ASX 200 over the decade ended November 2016 was 14.31%. This shows just how far actual returns swung from the average total annualised return of 4.46% over the same period. The maximum drawdown as measured from the peak to valley of the S&P/ASX200 during the global financial crisis (GFC) period of 2007 to 2009 was -50.6%.
This volatility has a significantly larger impact on retirees or those near retirement, which is described by the sequence of return risk. As they are no longer making contributions and are drawing an income, they miss out on the benefits of compound interest as markets eventually rebound.
There are several strategies to manage this volatility, which provides a crucial benefit, although they all act as a drag on investment returns.
However, typical benchmarks portray this as blunt underperformance rather than a more efficient way to balance risk and return.
Better ways to measure risk and return
Retirees and those close to retirement are the least well placed to absorb the volatility and potential for capital losses which form an inherent part of most benchmarks.
They need strategies to reshape their personal risk-return profile and then more accurately measure them against better benchmarks. But measuring risk is less simple than measuring returns.
Investment returns are tangible and highly sought after. Risk comes in many different guises and is something to be handled with extreme caution (or even avoided).
There are several investment ratios which measure different aspects of risk–the Sharpe Ratio is one of the most well-known. It measures the average return received for incurring an additional unit of risk above the risk-free rate, using the standard deviation of past returns as a proxy for risk.
The S&P Managed Risk Indices, recently launched in collaboration with Milliman, are an example of an improved way to measure the performance of capital-protected products.
The following diagram compares risk-adjusted returns (the Sharpe Ratio) against maximum drawdown. A managed risk portfolio (which uses a two-step risk management overlay to control volatility to a set level and then applies a synthetic put position to further reduce the downside risk) significantly outperformed an unmanaged portfolio on this basis.
Figure 1: Historical sharpe ratio and maximum drawdown: Managed risk indices versus unmanaged portfolios
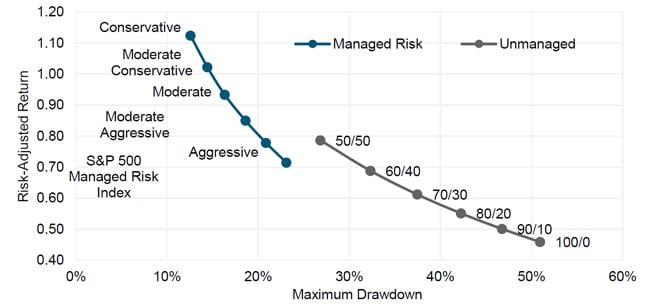
However, this outperformance is different than outperforming a typical index such as the S&P 500. This more nuanced measure isn’t a comparison against absolute investment returns, but of returns per unit of risk–a far better measure for retirees. The objective of an efficient capital-protected strategy should be maximising risk-adjusted return relative to minimising maximum portfolio loss. For retirees, minimisation of loss and volatility of returns is of paramount importance to meet their income needs throughout retirement.
Why risk management is needed across all market conditions
The GFC ushered in a very different set of market conditions. Central banks slashed interest rates to historic lows in many developed countries and began buying a range of assets with newly printed money under quantitative easing programs.
This propelled many asset classes to new highs and dampened overall market volatility (although punctuated by occasional extreme spikes as markets responded to the actions of central banks).
This has been challenging for many risk management strategies.
Under these market conditions, even low-cost, futures-based strategies have, in some cases, cut 3% to 5% from annualised short-term equity returns while option-based protection strategies have experienced even larger drags on performance.
Protection strategies relying on put options (which grant the buyer the right to sell the underlying index at a pre-determined price before a set maturity date) suffer from relatively high costs compared to dynamic futures hedging strategies. This is why put option-based strategies also typically rely on the fund manager’s discretionary trading or limit the amount of protection during certain periods.
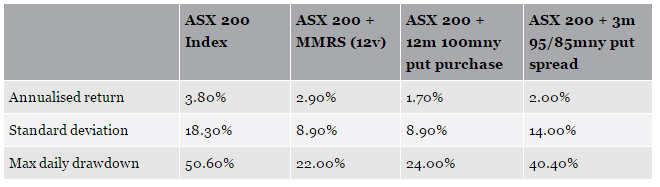
The following table shows that a dynamic futures hedging strategy (in this case, the Milliman Managed Risk Strategy™ (MMRS) which uses futures contracts to manufacture long-dated put options) produced the best blend of risk and return compared to two option-based strategies.
Figure 2: Comparison of protection strategies (2007 – October 2016)
Disclaimer: These results are based on simulated or hypothetical performance results that have certain inherent limitations. Unlike the results shown in an actual performance record, these results do not represent actual trading. Also, because these trades have not actually been executed, these results may have under-or over-compensated for the impact, if any, of certain market factors, such as lack of liquidity. Simulated or hypothetical trading programs in general are also subject to the fact that they are designed with the benefit of hindsight. No representation is being made that any account will or is likely to achieve profits or losses similar to these being shown. Milliman does not manage the underlying fund(s). Any index performance information is for illustrative purposes only, does not represent the performance of any actual investment or portfolio. It is not possible to invest directly in an index.
While all three strategies underperformed the S&P/ASX 200 on a pure annualised return basis, as we have seen, such headline comparisons are made against benchmarks which don’t take into account risk. With managed risk, volatility remains significantly lower and risk-adjusted returns are significantly higher–these are key attributes of major importance to retirees.
Investors may also now be at the cusp of a change in market conditions which will bring risk management back to the fore.
Bond markets were dramatically sold off towards the end of 2016 as market expectations for inflation and growth climbed after the election of Donald Trump as US president. The November surge in global yields has already resulted in the worst monthly loss in the Bloomberg Barclays Global Aggregate Total Return Index, which lost 4% in November, the deepest slump since the gauge’s inception in 1990.
Moving forward, the expectation of diversification benefits of bonds in a negative equity environment may be overly optimistic.
Meanwhile, the market is beginning to realise that central banks are preparing to tighten their quantitative easing (QE) taps ahead of switching them off.
Systematic strategies that offer a predictable and cost-effective way to manage risk more explicitly remain a sound way to counter complex and interrelated forces which are difficult to predict. The alternative is attempting to time markets, which is a strategy no better than rolling the dice.
The article was first published on Milliman website.
Disclaimer
This document has been prepared by Milliman Pty Ltd ABN 51 093 828 418 AFSL 340679 (Milliman AU) for provision to Australian financial services (AFS) licensees and their representatives, [and for other persons who are wholesale clients under section 761G of the Corporations Act].
To the extent that this document may contain financial product advice, it is general advice only as it does not take into account the objectives, financial situation or needs of any particular person. Further, any such general advice does not relate to any particular financial product and is not intended to influence any person in making a decision in relation to a particular financial product. No remuneration (including a commission) or other benefit is received by Milliman AU or its associates in relation to any advice in this document apart from that which it would receive without giving such advice. No recommendation, opinion, offer, solicitation or advertisement to buy or sell any financial products or acquire any services of the type referred to or to adopt any particular investment strategy is made in this document to any person.
The information in relation to the types of financial products or services referred to in this document reflects the opinions of Milliman AU at the time the information is prepared and may not be representative of the views of Milliman, Inc., Milliman Financial Risk Management LLC, or any other company in the Milliman group (Milliman group). If AFS licensees or their representatives give any advice to their clients based on the information in this document they must take full responsibility for that advice having satisfied themselves as to the accuracy of the information and opinions expressed and must not expressly or impliedly attribute the advice or any part of it to Milliman AU or any other company in the Milliman group. Further, any person making an investment decision taking into account the information in this document must satisfy themselves as to the accuracy of the information and opinions expressed. Many of the types of products and services described or referred to in this document involve significant risks and may not be suitable for all investors. No advice in relation to products or services of the type referred to should be given or any decision made or transaction entered into based on the information in this document. Any disclosure document for particular financial products should be obtained from the provider of those products and read and all relevant risks must be fully understood and an independent determination made, after obtaining any required professional advice, that such financial products, services or transactions are appropriate having regard to the investor's objectives, financial situation or needs.
All investment involves risks. Any discussion of risks contained in this document with respect to any type of product or service should not be considered to be a disclosure of all risks or a complete discussion of the risks involved.
An investment in an underlying portfolio, whether with or without Milliman Managed Risk Strategy (MMRS) is subject to market and other risks and no guarantee or assurance is given by Milliman AU or any company in the Milliman group that the use of MMRS in connection with an underlying portfolio will not give rise to losses or that the performance of the MMRS in relation to the underlying portfolio will remove volatility completely or to the extent depicted in an illustration or fully replace losses in the underlying portfolio or to the extent depicted. While generally assets used in connection with the MMRS are liquid, this may not be the case in all circumstances. Further, during periods of sustained market growth, the return to clients from the combination of an underlying portfolio and MMRS should be less than if a client had no MMRS.
Any source material included in this document has been sourced from providers that Milliman AU believe to be reliable from information available publicly or with consent of the provider of the source material. To the fullest extent permitted by law, no representation or warranty, express or implied is made by any company in the Milliman group as to the accuracy or completeness of the source material or any other information in this document. Logos or names of companies that Milliman AU has partnered with for the development of products using MMRS have been reproduced with the consent of those companies but must not be taken to be a recommendation by those companies with respect to MMRS.
Any hypothetical, backtested data illustrated herein is for illustrative purposes only, and is not representative of any investment or product. RESULTS BASED ON SIMULATED OR HYPOTHETICAL PERFORMANCE RESULTS HAVE CERTAIN INHERENT LIMITATIONS. UNLIKE THE RESULTS SHOWN IN AN ACTUAL PERFORMANCE RECORD, THESE RESULTS DO NOT REPRESENT ACTUAL TRADING. ALSO, BECAUSE THESE TRADES HAVE NOT ACTUALLY BEEN EXECUTED, THESE RESULTS MAY HAVE UNDER-OR OVER-COMPENSATED FOR THE IMPACT, IF ANY, OF CERTAIN MARKET FACTORS, SUCH AS LACK OF LIQUIDITY. SIMULATED OR HYPOTHETICAL TRADING PROGRAMS IN GENERAL ARE ALSO SUBJECT TO THE FACT THAT THEY ARE DESIGNED WITH THE BENEFIT OF HINDSIGHT. NO REPRESENTATION IS BEING MADE THAT ANY ACCOUNT WILL OR IS LIKELY TO ACHIEVE PROFITS OR LOSSES SIMILAR TO THESE BEING SHOWN. For any hypothetical simulations illustrated, Milliman AU does not manage, control or influence the investment decisions in the underlying portfolio. The underlying portfolio in hypothetical simulations use historically reported returns of widely known indices. In certain cases where live index history is unavailable, the index methodology provided by the index may be used to extend return history. To the extent the index providers have included fees and expenses in their returns, this information will be reflected in the hypothetical performance.